Analyze the communication between application and reader
BALTECH SDK comes with a montitoring mechanism to analyze the communication between your application and the reader. When you enable monitoring, all commands and responses exchanged will be written to an HTML log file.
Monitoring requires SDK v3.04 or above. Environment variable configuration and programmatic log path/anchor functions require SDK v4.0.0 or above.
Log content
Logs capture the communication between your application and the reader. If you use encryption, logs capture encrypted traffic by default 1. To log traffic in plaintext when using encryption, run brp_set_monitor(brp, BRP_MONITOR_PLAINTEXT).
Privacy measures
To help you protect the data in plaintext logs, we've implemented the following measures:
- By default, monitoring is only active when you manually create a log directory for the current day. This prevents you from accidentally monitoring longer periods of time.
- Logs are created in your home directory, i.e. other users on the same computer cannot access them.
Enable monitoring
You can enable monitoring either via environment variable or by creating a log directory.
Option 1: Environment variable (recommended)
Set the BRP_LOGS environment variable to one of the following values:
| Value | Description |
|---|---|
auto |
Default behavior: Logs are only written when a log directory for the current day exists. |
enabled |
Always write logs. The log directory is created automatically if it doesn't exist. |
disabled |
Never write logs, even if a log directory exists. |
Restart your application after changing the environment variable.
Option 2: Create log directory manually
-
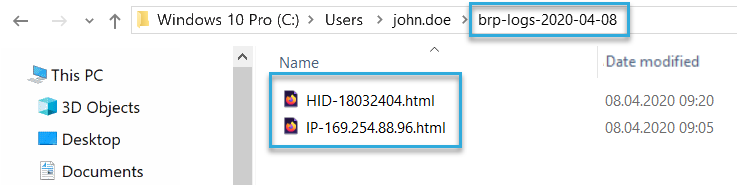
In your home directory, create the following folder structure:
brp-logs/<yyyy>-<mm>-<dd>In this folder, 1 HTML log file per reader will be created, capturing the communication that took place on that day. The log file name is as follows:- For Ethernet:
IP-<IP address>.html - For USB HID:
HID-<reader serial number>.html - For RS-232/UART or virtual COM port:
RS232-<COM port name>.html
- For Ethernet:
-
To create logs for e.g. the next day, create a new subfolder with the new date.
Restart your application after creating the folder.
Configure log path programmatically
You can change the log file path at runtime using brp_set_log_path(). This closes the current log file and opens a new one at the specified path.
Read the logs
Browser support
You can view the HTML log files in any browser. For large files, however, we recommend Google Chrome or Microsoft Edge for performance reasons.
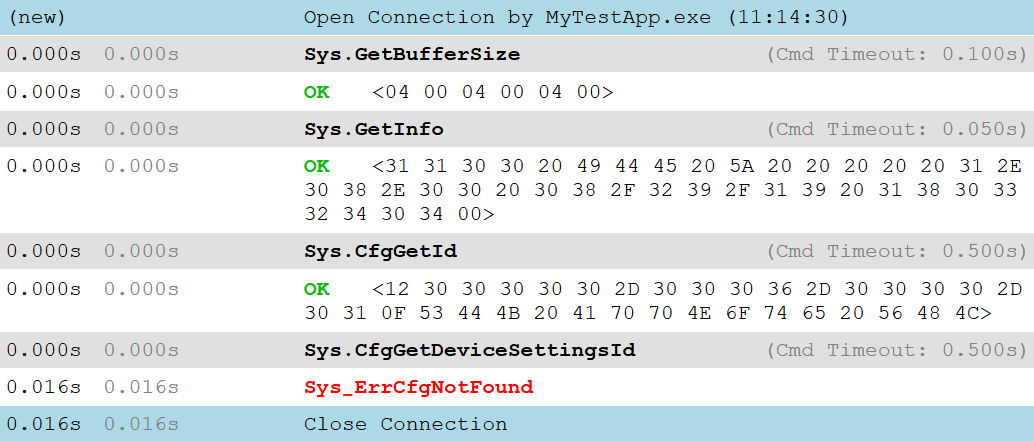
The start and end of every connection to the reader is indicated by a blue line. In between these lines, you'll see the commands and responses transmitted between the SDK and the reader. The timestamps are relative to the opening of the connection. Command parameters and return values are shown between angle brackets.
Get more detailed information
- Error codes: Click an error code to go to the error group overview page in the wrapper functions reference. Here, you can select the error code to get a detailed description (learn more about error codes and groups).
- Command codes: Click a command code to go to the respective page in the commands reference.
Expand and collapse annotations
Log entries with additional details (e.g. command parameters) are collapsed by default, showing only the first line. Click on an entry to expand it and see all details. Use the Expand All Annotations / Collapse All Annotations toggle button to expand or collapse all entries at once.

Retrieve certain entries
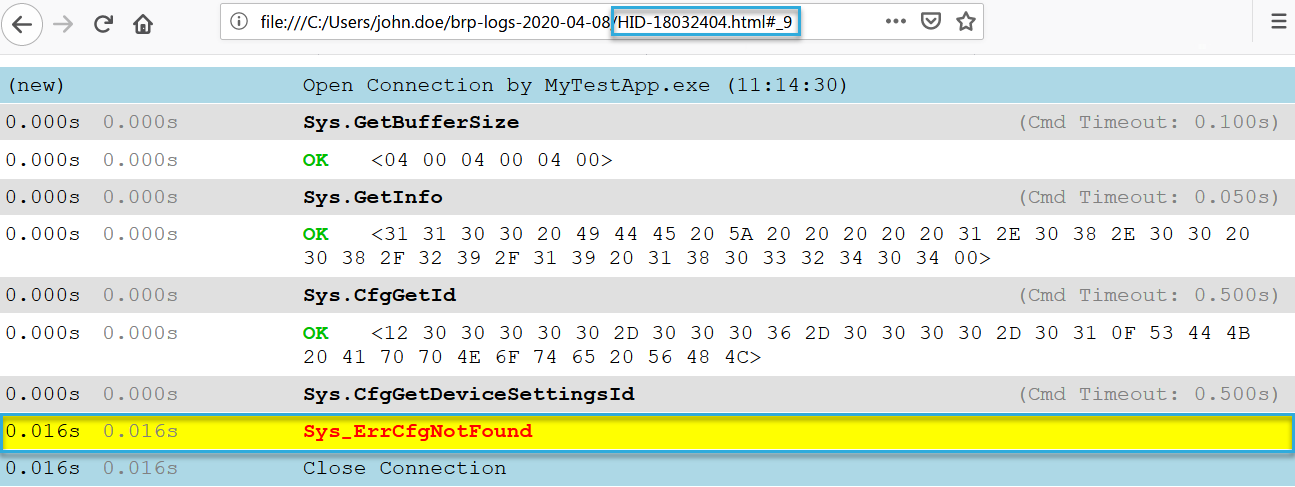
Click a timestamp to generate a link to a specific log entry. With this link, you can later easily retrieve this entry or refer a colleague to it (if you also choose to give them access to the file).
To retrieve log entry anchors programmatically, use brp_get_log_anchor(). This allows you to create links to specific log entries from your code.
Activate live view
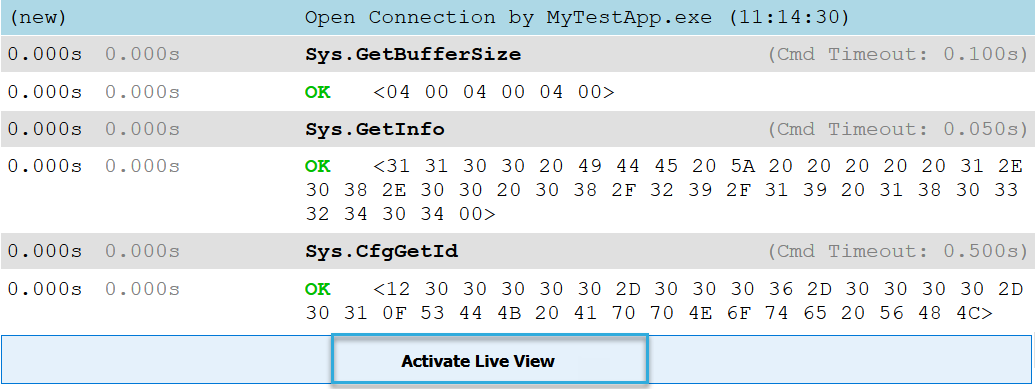
At the top of the log, click Activate next to Live View to update the log while you have it open. To stop Live View, click Deactivate*.
Further low-level analyses
If the SDK logs contains an I/O error that can't be explained, we recommend you take a closer look using Wireshark or another low-level protocol analyzer. This approach works for host-reader connections via USB HID, RS-232/UART, virtual COM port, and Ethernet.
-
In SDK versions below v3.19.00, encrypted communication between application and SDK was always monitored in plaintext. Sensitive information, e.g. data you write to a card, was logged in plaintext. Thus, if you transfer sensitive data via an encrypted connection, we recommend you update the SDK to v3.19.00 or above and explicitly run brp_set_monitor(brp, BRP_MONITOR_ENABLED). ↩